Sustainability Metrics Coffee Mills Can Actually Track During Wet Processing
Sustainability in coffee wet processing is often discussed in broad terms: less water, cleaner discharge, lower waste. On the plant floor, those goals only become useful when they are tied to numbers that operators can measure batch after batch.
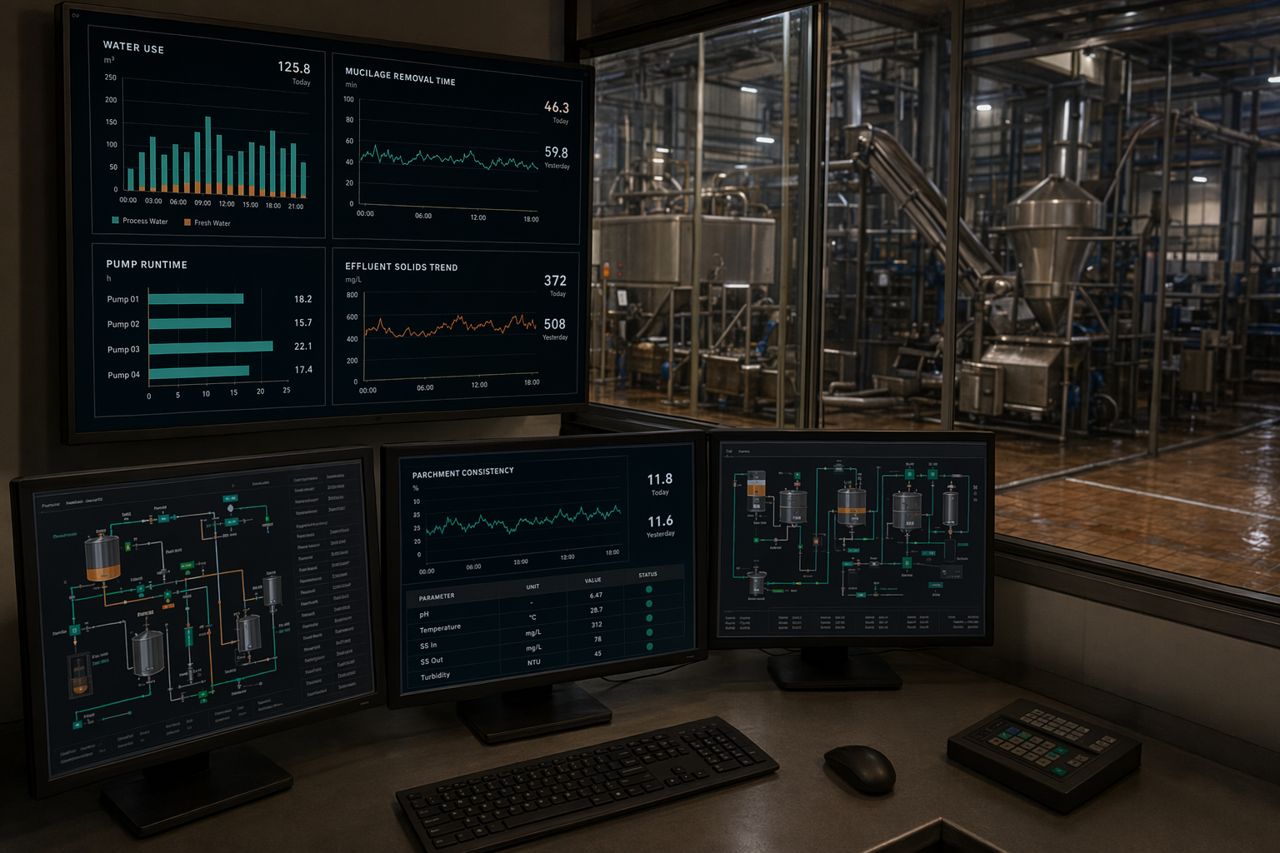
For a coffee processing plant, the strongest sustainability program is not built around a single claim. It is built around a repeatable KPI set: water drawn, wash water reused, mucilage removal time, solids loading, energy per batch, filtration behavior, and final parchment consistency.
As an enzyme supplier for coffee processing, Parchline Catalytics works with mills that want sustainability targets to connect directly to throughput, quality control, and operating cost.
Start With Metrics Operators Already Touch
The best wet-processing metrics do not require a new reporting culture. They build from data already visible in the mill:
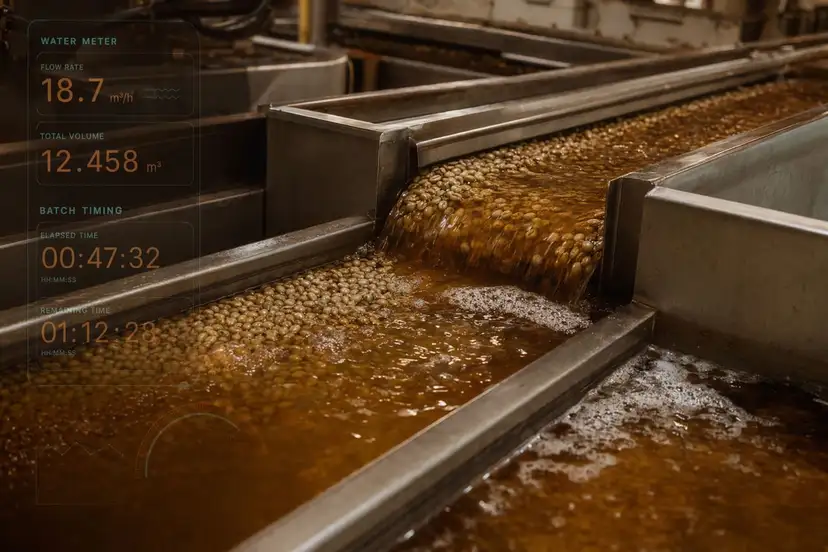
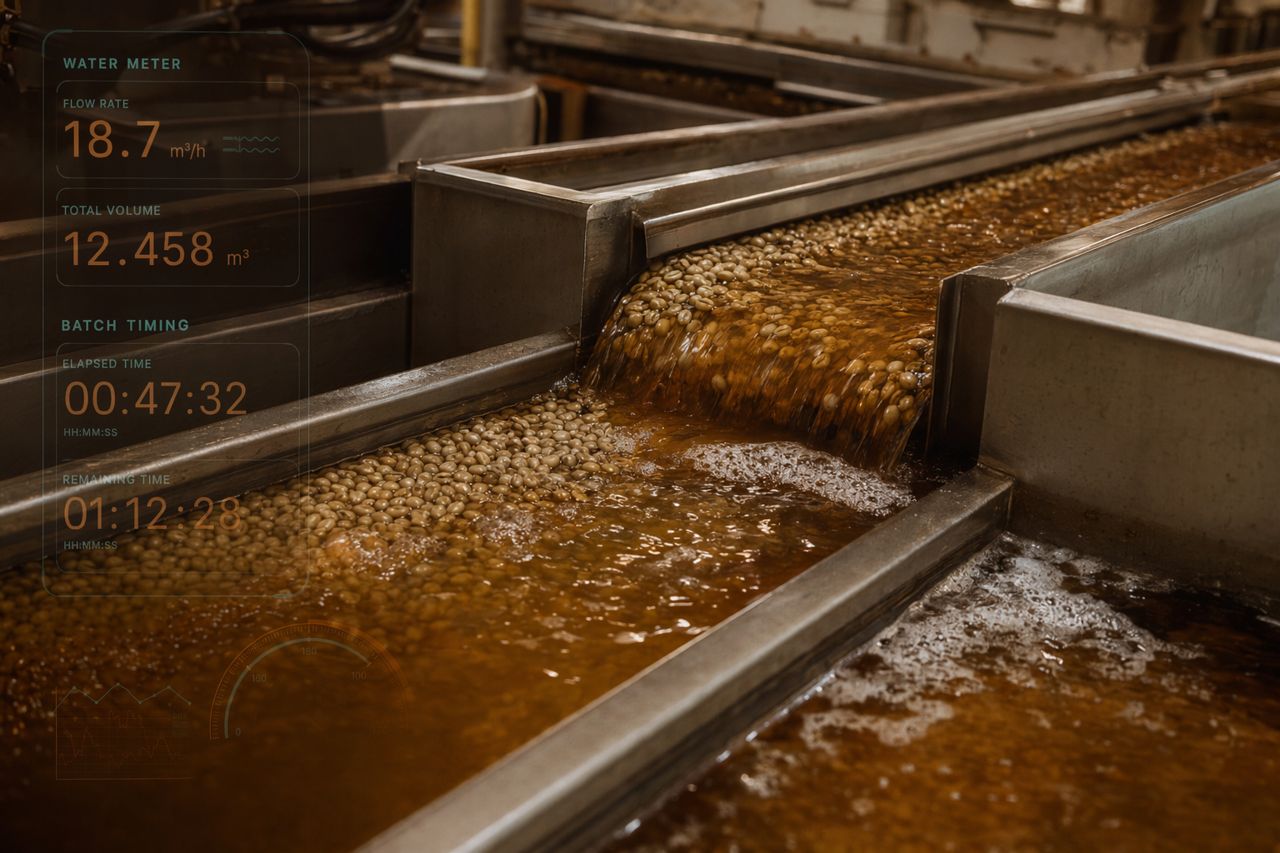
- Water meter readings by line, shift, or batch
- Tank fill volumes and drain frequency
- Fermentation or holding time by lot
- Pump runtime and recirculation duration
- Wash channel clarity and solids carryover
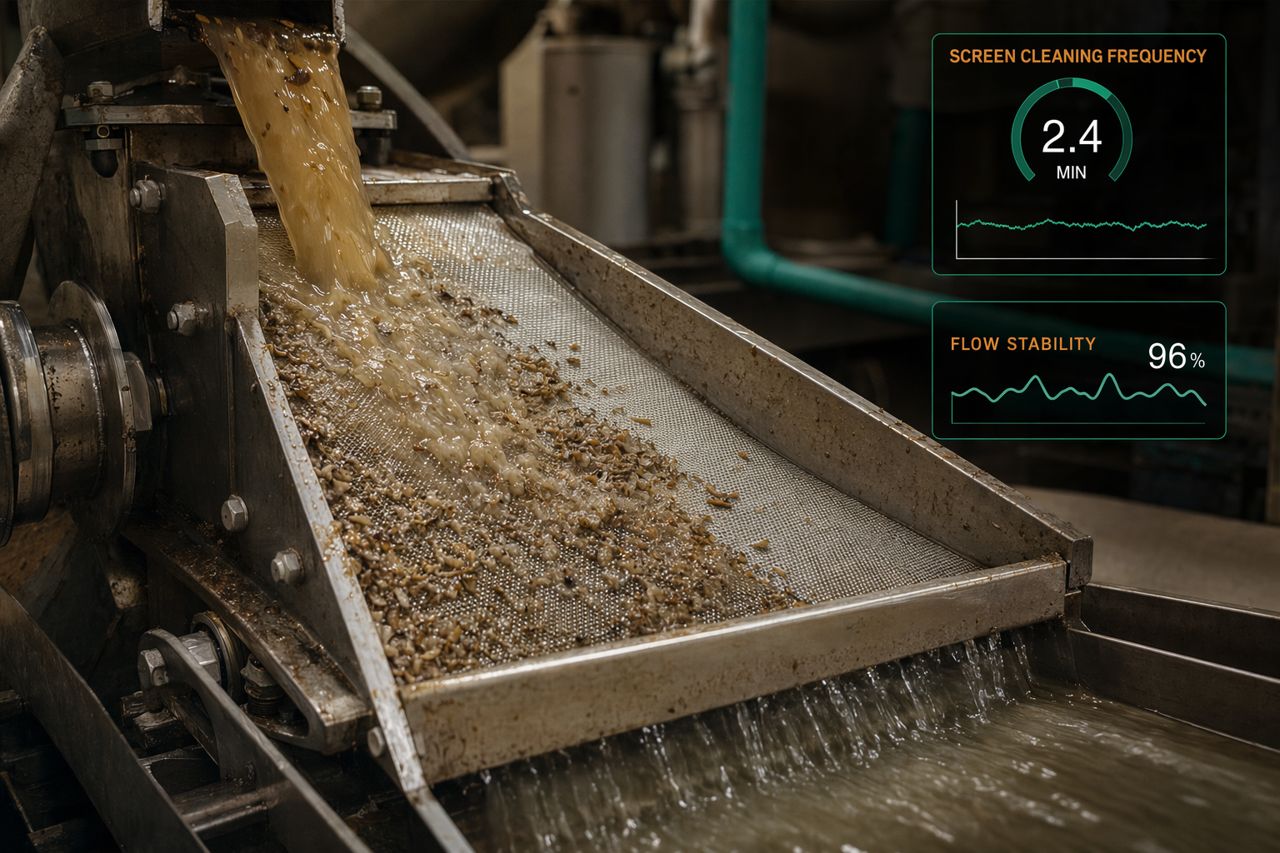
- Screen, separator, or filter cleaning frequency
- Effluent pH, suspended solids, and oxygen-demand results where monitored
- Rework, over-washing, or delayed drying events
A useful sustainability dashboard should answer one commercial question: did the process use fewer resources while keeping the coffee within specification?
KPI 1: Water Use Per Processed Lot
Water is the most visible wet mill metric, but it is also easy to misread. Total water use can fall simply because volume is lower. A more useful KPI normalizes water use against processed cherry, parchment, or green coffee output.
Track:
- Incoming water by shift or production day
- Wash water used per lot
- Rinse or final-clean water additions
- Reuse ratio where recirculation is practiced
- Discharge volume by process stage when possible
The operational target is not just lower water. It is stable mucilage removal with less wash correction, less re-rinsing, and fewer stalled batches.
KPI 2: Mucilage Removal Time
Wet processing sustainability is strongly affected by how long coffee sits in tanks, channels, or demucilaging steps before it reaches the required cleanliness.
Track:
- Start and finish time for each lot
- Time to reach target tactile cleanliness
- Time waiting for available washing or drying capacity
- Variation between lots from different cherry maturity profiles
Enzyme-supported processing can help mills reduce the time required to loosen and separate pectin-rich mucilage. The important metric is not a laboratory number. It is the process result: faster release, cleaner separation, and repeatable timing under mill conditions.
KPI 3: Viscosity and Flow Behavior
Mucilage-rich water can become difficult to pump, screen, settle, or filter. Even without formal viscosity testing, mills can track practical flow indicators.
Track:
- Pump load or runtime for transfer steps
- Channel flow interruptions
- Screen blinding or filter cleaning frequency
- Sludge handling time
- Settling behavior in collection tanks
- Operator interventions needed to restore flow
When viscosity falls, the plant usually sees benefits beyond sustainability reporting. Lines clear faster. Screens hold longer. Pumps cycle more predictably. Operators spend less time recovering from slow flow.
KPI 4: Effluent Solids and Organic Load
Wet mill effluent is a major sustainability focus because mucilage, pulp fines, and dissolved organics can increase treatment demand. Mills should track what they can consistently monitor and use outside lab support where needed.
Track:
- Suspended solids trends
- pH movement by process stage
- Settled sludge volume
- Oxygen-demand results where tested
- Frequency of treatment system overloads
- Odor or stagnation events as operational warnings
The goal is not to claim zero impact. The goal is to reduce uncontrolled loading, improve separation before discharge, and make treatment behavior more predictable.
KPI 5: Throughput Without Over-Washing
A sustainability improvement that slows the mill may not survive peak harvest pressure. Throughput must be part of the scorecard.
Track:
- Lots completed per shift
- Bottleneck stage by hour
- Tank occupancy time
- Wash channel capacity utilization
- Time from depulping to drying entry
- Rework caused by incomplete mucilage removal
An enzyme program should be evaluated against both process speed and resource intensity. A shorter wet-processing cycle can reduce water and energy exposure, but only if parchment cleanliness remains within target.
KPI 6: Energy Tied to Pumping, Mixing, and Transfer
Energy use in wet processing often hides inside pump runtime, recirculation, agitation, and extra cleaning cycles. Instead of tracking only total site electricity, isolate the process drivers that operators can influence.
Track:
- Pump runtime per batch or shift
- Recirculation duration
- Agitator runtime where used
- Cleaning cycle frequency
- Compressed air use if present in controls or valves
Lower-viscosity process water and cleaner separation can reduce the number of corrective cycles needed to move and clarify the system.
KPI 7: Consistency at the Drying Interface
The sustainability report should not stop at the wet line. If wet processing produces uneven parchment condition, the drying stage may need extra time, extra handling, or rework.
Track:
- Parchment cleanliness at transfer
- Moisture variation entering drying
- Drainage behavior after washing
- Lot segregation due to process inconsistency
- Defect trends connected to delayed washing or uneven fermentation
Sustainability and quality control converge here. A controlled wet process reduces downstream variability.
Building a Plant-Level Baseline
Before changing chemistry, equipment, or operating procedure, establish a baseline that reflects normal production.
A practical baseline should include:
- At least several representative operating days
- Different cherry maturity conditions where possible
- Current water use and discharge patterns
- Current mucilage removal timing
- Current screen, pump, and filtration constraints
- Final parchment quality checks
- Operator notes on interventions and bottlenecks
The baseline does not need to be perfect. It needs to be consistent enough that a trial result can be compared honestly.
Where Enzyme Solutions Fit
Parchline Catalytics focuses on enzyme solutions for coffee processing plants where mucilage breakdown, viscosity reduction, extraction support, filtration, or separation consistency are measurable business issues.
In wet processing, enzyme use is typically evaluated for its ability to:
- Support faster mucilage loosening
- Reduce wash water correction
- Improve flow through channels, screens, or filters
- Lower solids carryover into downstream handling
- Stabilize batch-to-batch timing
- Reduce unplanned cleaning and operator intervention
The decision should be made with process data, not assumptions. The right trial design connects enzyme addition to KPIs that the mill already values.
A Simple Trial Scorecard
For a wet mill trial, we recommend a short, disciplined scorecard:
| KPI |
Baseline |
Trial Run |
Target Direction |
| Water used per processed lot |
Current average |
Recorded by lot |
Lower or more controlled |
| Mucilage removal time |
Current average |
Recorded by lot |
Shorter and less variable |
| Wash correction events |
Operator log |
Operator log |
Fewer events |
| Screen or filter cleaning |
Current frequency |
Trial frequency |
Less frequent |
| Pump or transfer runtime |
Current runtime |
Trial runtime |
Lower or smoother |
| Effluent solids trend |
Current trend |
Trial trend |
Reduced or more stable |
| Parchment consistency |
QC record |
QC record |
Maintained or improved |
A successful result should show operational control, not just one favorable number.
What to Avoid in Sustainability Reporting
Coffee wet mills should be careful with claims that are not tied to measurement.
Avoid:
- Reporting lower water use without production normalization
- Treating one clean batch as proof of a seasonal trend
- Separating sustainability claims from parchment quality
- Ignoring downtime, rework, or operator workload
- Comparing lots with different maturity, temperature, or holding time without notes
Plant-floor credibility comes from repeatable results.
Request a Quote for a Wet-Processing Enzyme Trial
If your mill is tracking water use, mucilage removal time, viscosity, filtration behavior, or effluent load, Parchline Catalytics can help structure an enzyme-supported trial around your operating KPIs.
Use the on-site request a quote form to share your process stage, current bottleneck, daily throughput, and target metric. Our team will respond with a practical recommendation for validation at plant scale.
Request a quote
Faceless Explainer Video
This page includes a one-minute faceless explainer video showing measurable wet-processing KPIs: water meters, stainless channels, mucilage separation, filtration behavior, effluent control, and a plant-level scorecard. The focus is practical validation, not vague sustainability language.